What are ensembles and why should you care?
You will often times see me reference the ensembles.
Meteorologists have many computer models to choose from when putting together a forecast.
What is a model?
It is software that simulates the atmosphere. The simulation images are the graphics you see posted each day.
.
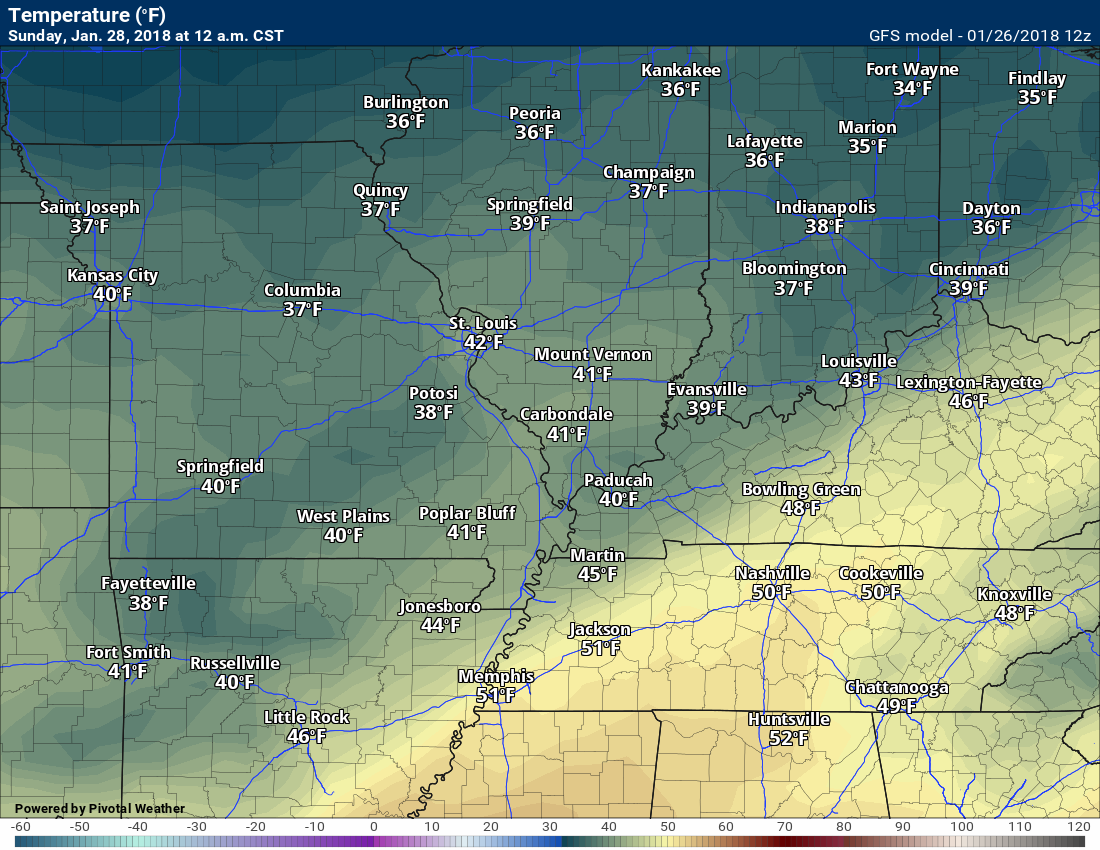
Here is an example of a graphic produced by the GFS model.
Here is an example of a graphic produced by the GFS model.
Click to enlarge the image
.
.
.
Models are created by running huge amounts of data (equations) into super computers. The computers then spit out images. Images such as high and low temperatures, dew points, wind speed, and so on.
There are many different models produced by many different countries.
There is the EC model. It is a European model. We sometimes call it the Euro.
There is the GEM model. It is a Canadian model.
There is the GFS model. It is an American model.
There are the NAM, Hrrr, and RAP models. These are also American model.
The EC does not just show you the weather for Europe. It produces American images, as well. Same for GEM and same for the GFS.
The Euro tends to be the most accurate model guidance. Not always. No model is perfect and each have biases.
Let me give you an example.
The GFS model.
The GFS tends to be too cold and too dry. Those are biases.
The GFS is an American model. The model is updated four times each day.
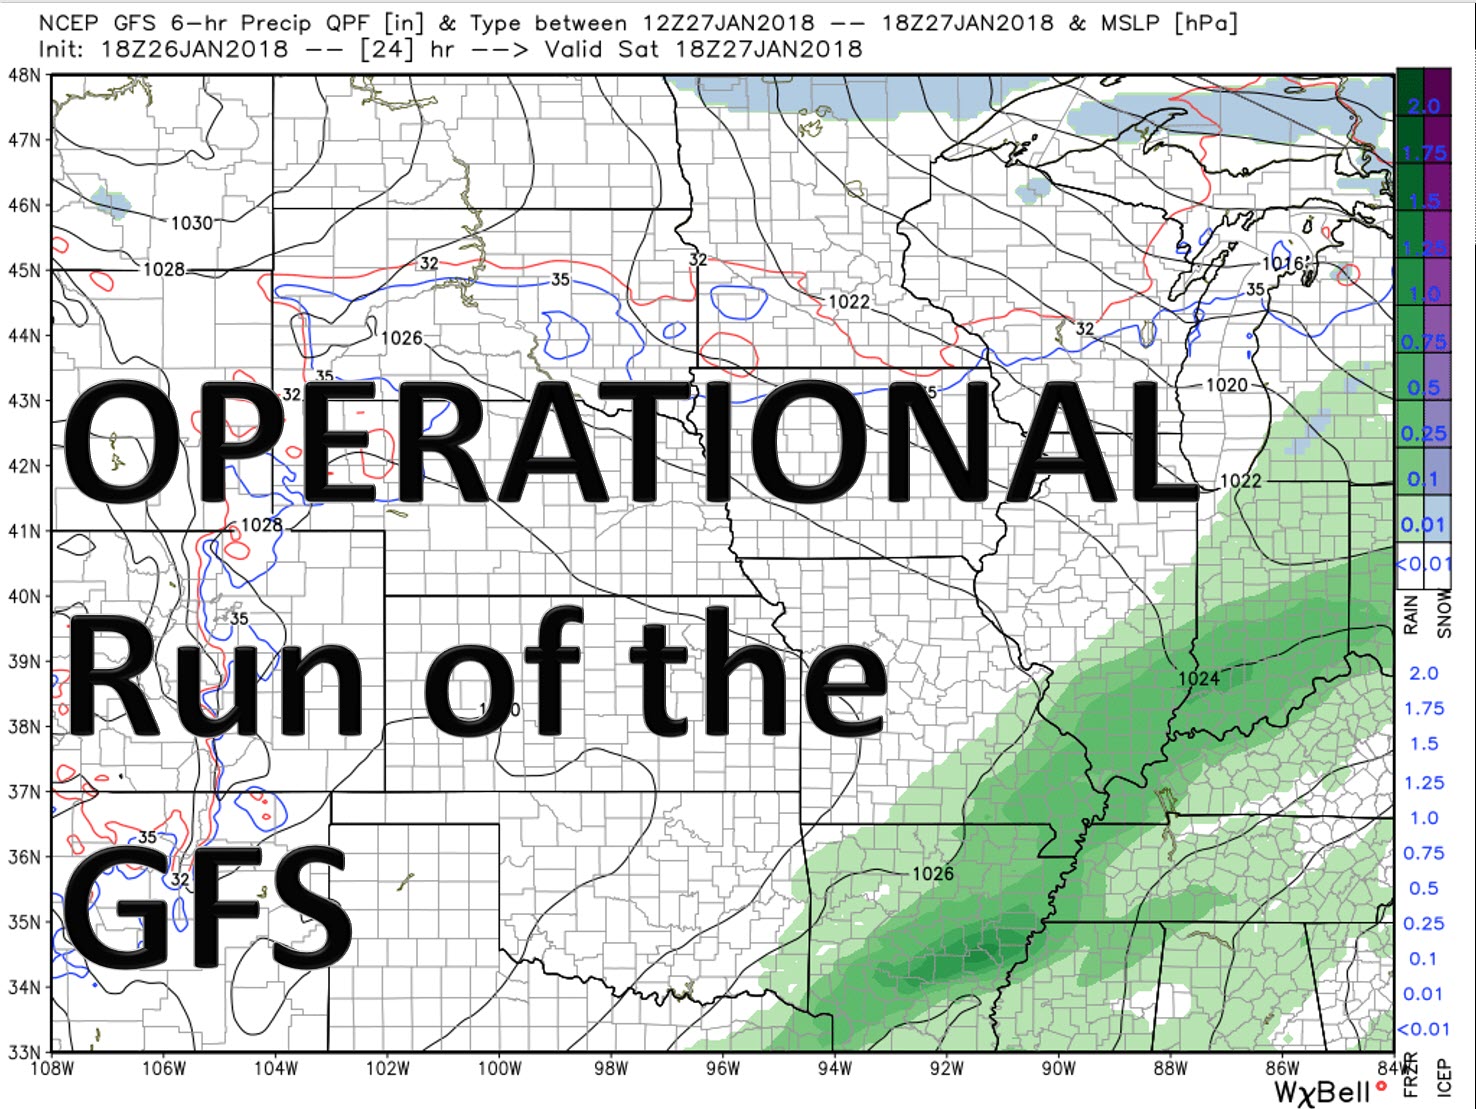
We call that one run of the GFS the deterministic or operational (I have seen it called several things). It is the “main” run of the GFS model.
The operational run is what you often times see people posting graphics from. I will post you an example below.
GFS ensembles. We call this the GEFS. The E is for ensemble.
What are ensembles?
An ensemble is when you take the computer model (in our example it is the GFS model) and run it over and over and over again.
What does run mean? It means you run the numbers/data through the computer again.
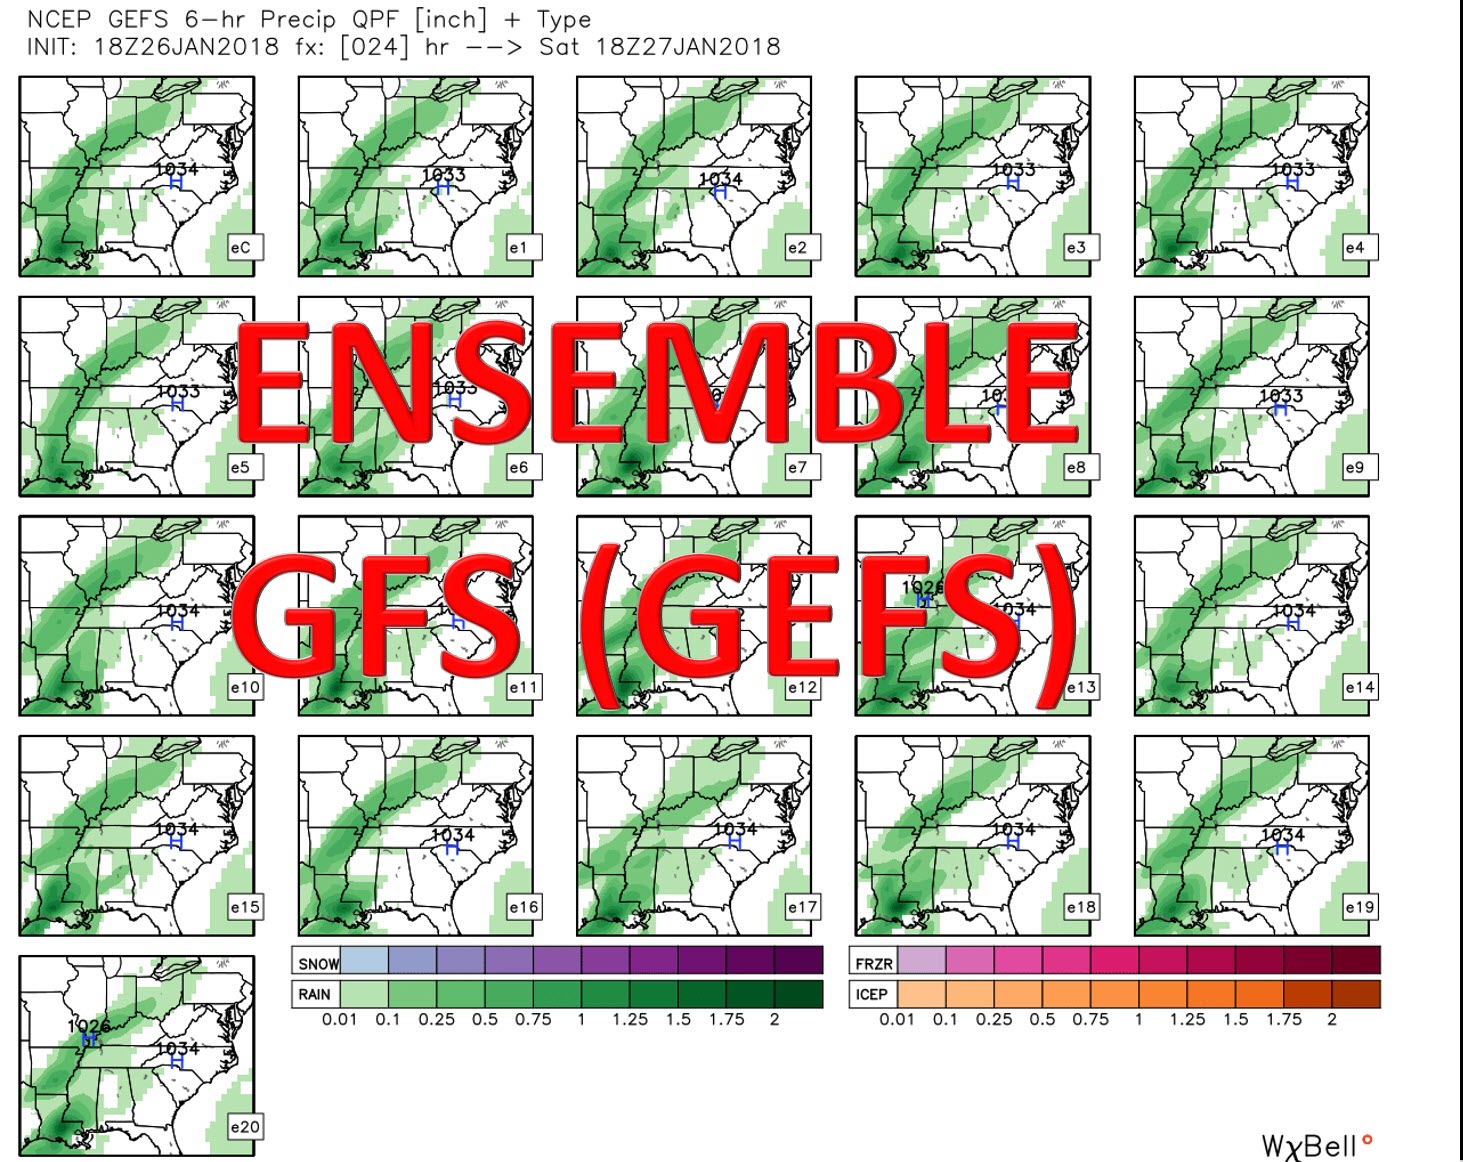
In this graphic (see below) it computes the numbers 21 times. There are 21 squares.
Each square is one run of the GFS model.
Each run starts with slightly different beginning variables. In other words, it is tweaked at the start.
Each run will show you the “what might happen” from changing the beginning conditions (slightly).
In this example, it is tweaked 21 times. Slightly different beginning variables.
In theory, the more squares that match, the higher the confidence in the forecast.
In this example, I chose to show you the operation run of the GFS for Saturday. Notice that it shows rain. Rain is represented by the green colors.
In this example, I chose to show you the GEFS ensembles for Saturday, as well.
How many of those squares show rain? All of them. Thus, there is high confidence in the forecast. It is going to rain.
With all of that said, you can’t just look at one ensemble graphic and figure out the forecast days in advance. It is just a tool.. Models are not gospel. They are guidance.
There are many other tools that have to be combined to actually make the forecast.
.
.