Wednesday, September 6, 2017
Calm weather for our region. Below normal temperatures and below normal dew points. Nice for early September.
Yes, some of us still need rain, but at least it is not oppressively hot and humid.
The overall outlook for the upcoming six to ten days is for more of the same. Below normal temperatures. Below normal precipitation.
The wild card in the forecast continues to be the eventual track of Hurricane Irma. Odds favor it staying out of our region, but some data does bring it towards the Ohio Valley. If that were to occur then some rain and gusty winds would occur.
Odds favor it missing our area. I will be monitoring the trends over the coming days.
Let’s take a look at some maps
Click images to enlarge
You can think the trough in the east for our cooler temperatures. Trough is a dip in the jet stream. Dipping into our region from the north. That delivers cooler weather, of course. Source of this air is Canada.
Here is the jet stream graphic from Wednesday afternoon
See the red? Those are wind speeds. Scale is at the bottom. It is diving in from the north. It then makes the turn and shifts back northeast. Trough.
Temperatures today were below normal. A few locations dipped into the lower to middle 40’s on Tuesday night.
Here is the Wednesday temperature anomaly map. Well below normal.
Normal high temperatures, for this time of the year, are around 85 degrees. Normal low temperatures are around 60 degrees.
Looking ahead
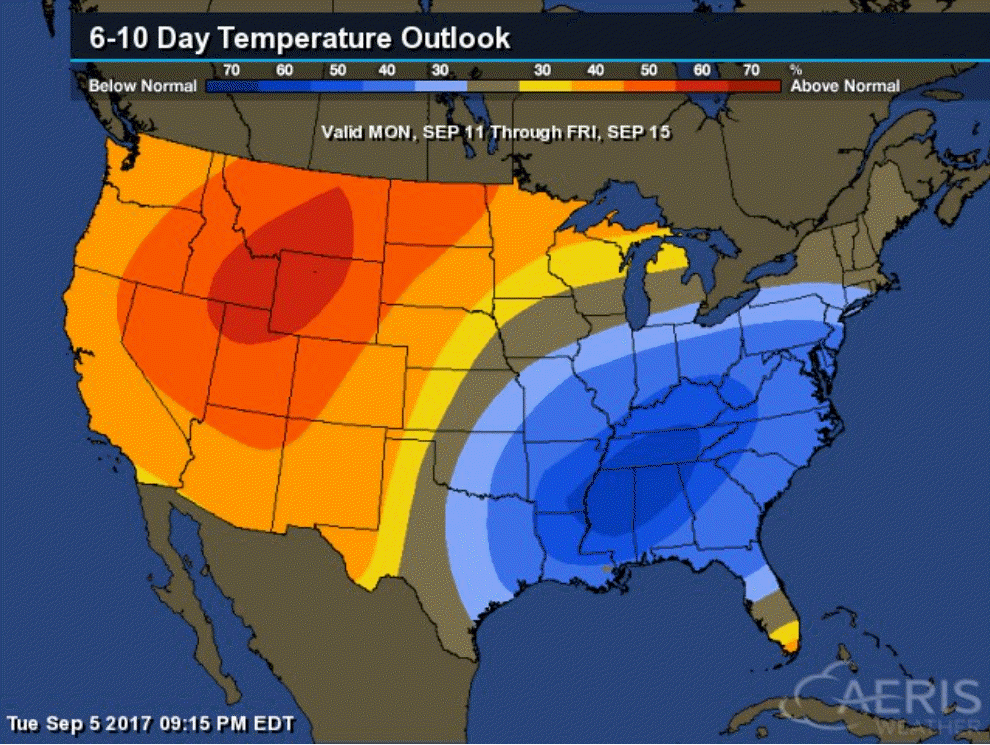
Here are the latest official six to ten and eight to fourteen day temperature and precipitation outlooks. Note the dates at the top of each graphic.
Monday, September 11th through Friday, September 15th
Probabilities favor temperatures remaining below normal
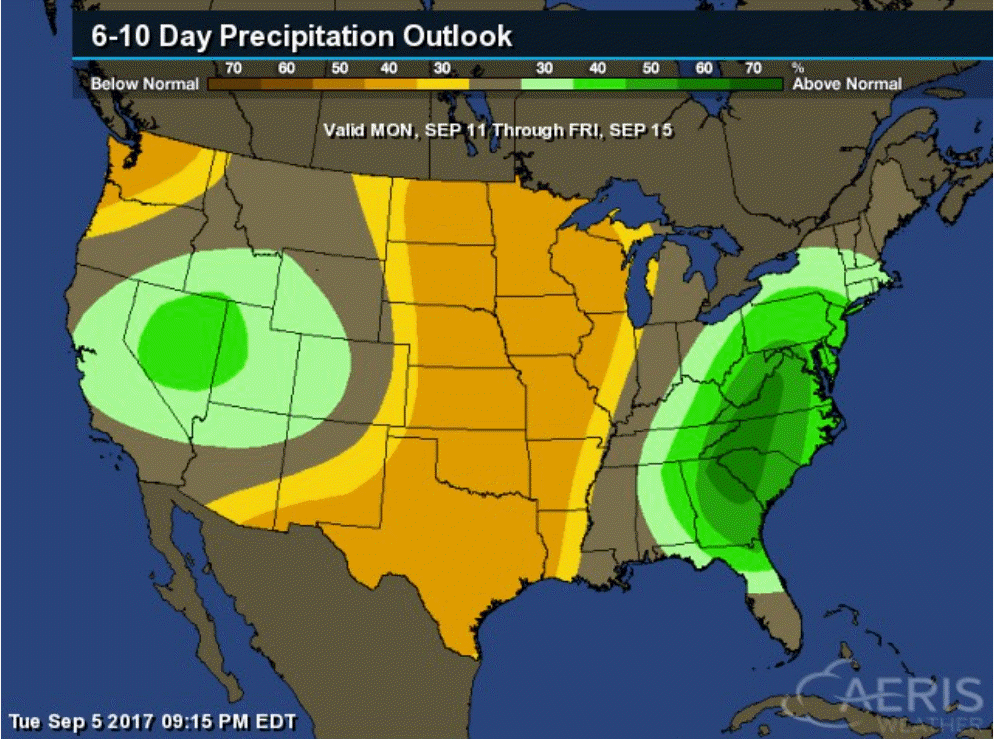
Monday, September 11th through Friday, September 15th
Probabilities favor below normal
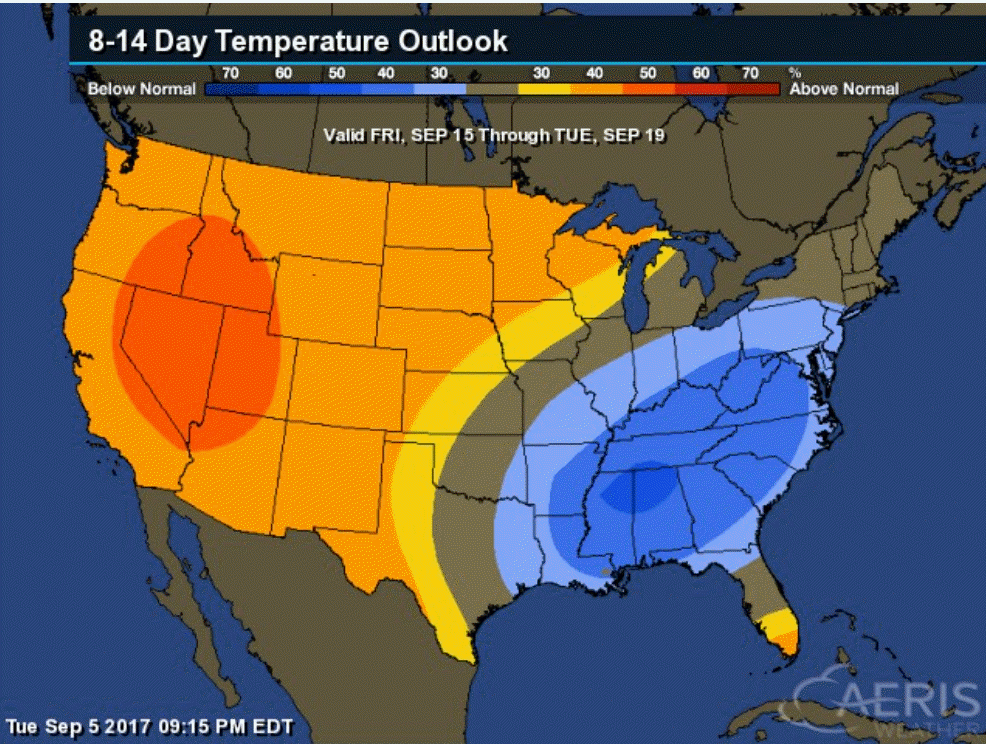
Here is the eight to fourteen day outlook
September 15th through September 19th
Temperature probabilities favor below normal readings
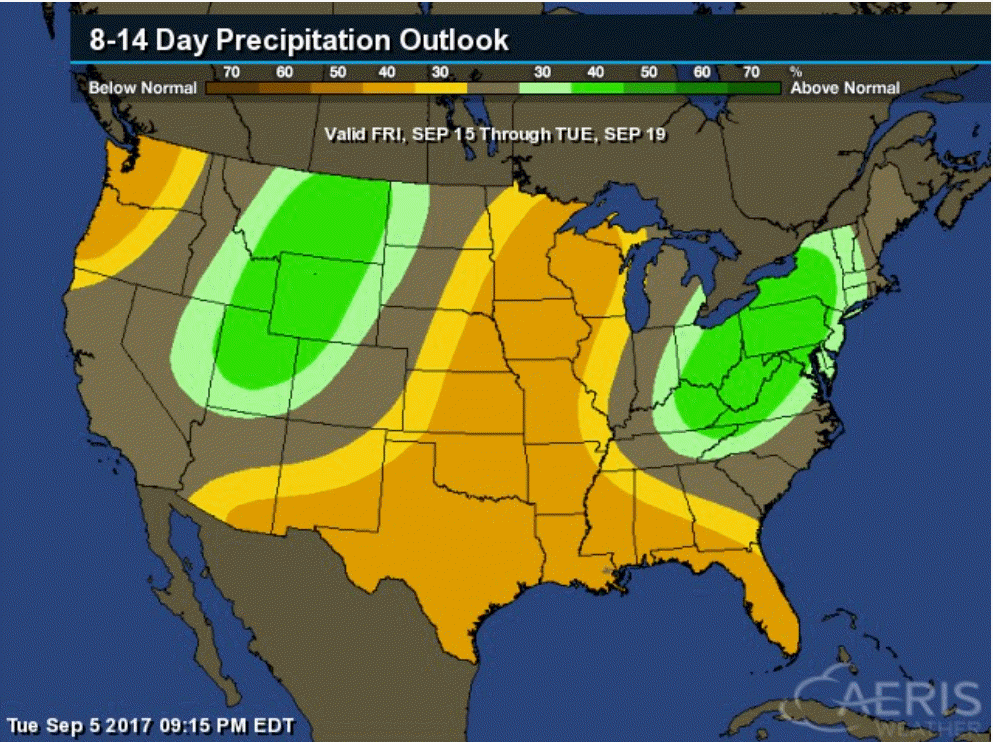
Precipitation outlook for the same time period
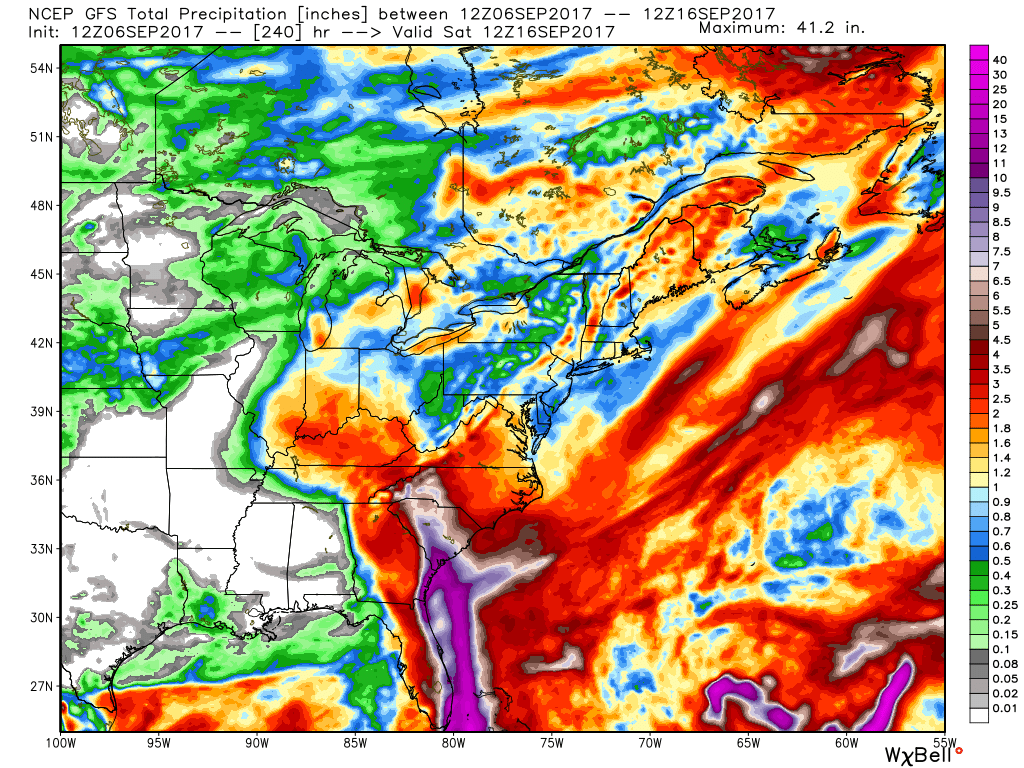
The GFS model guidance brings the remnants of Irma into our region. Let’s take a look at that.
This is currently a low end risk. Odds favor this system staying to our south and east. With that said, nothing is set in stone. The models continue to try and figure out Irma’s eventual path.
We can track the low. See the lines? The black lines in a circle around southern Florida would be the center of Irma. The track continues to shift east. Not sure how far east we will end up, but these graphics will be outdated later tonight.
The trend is east. Trend is important. Typically, the model guidance trends are the best indicator as to what will eventually happen.
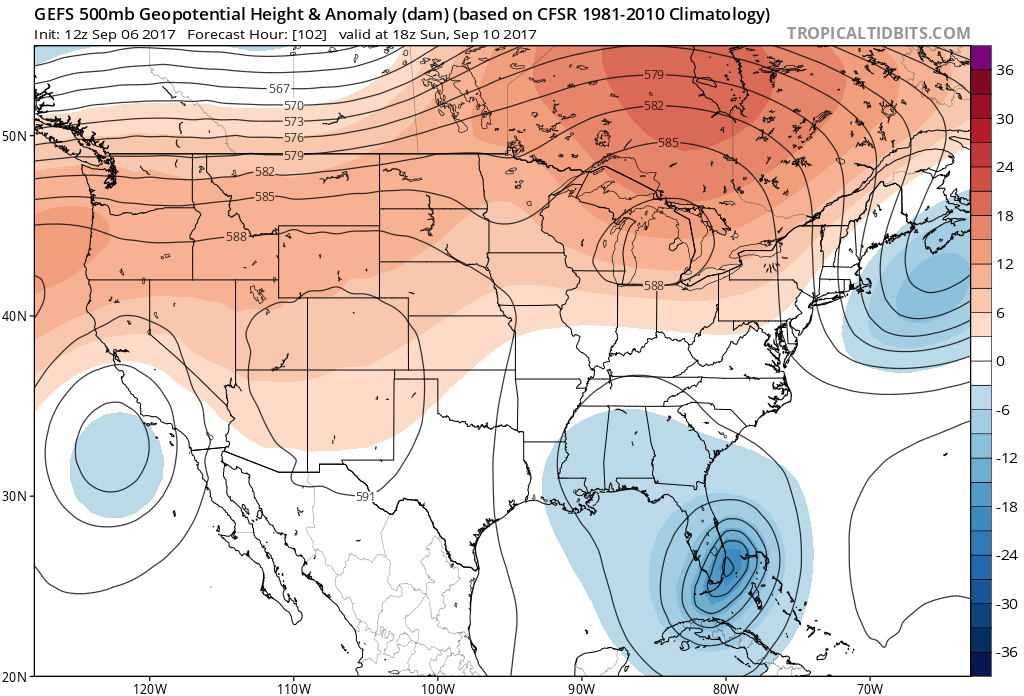
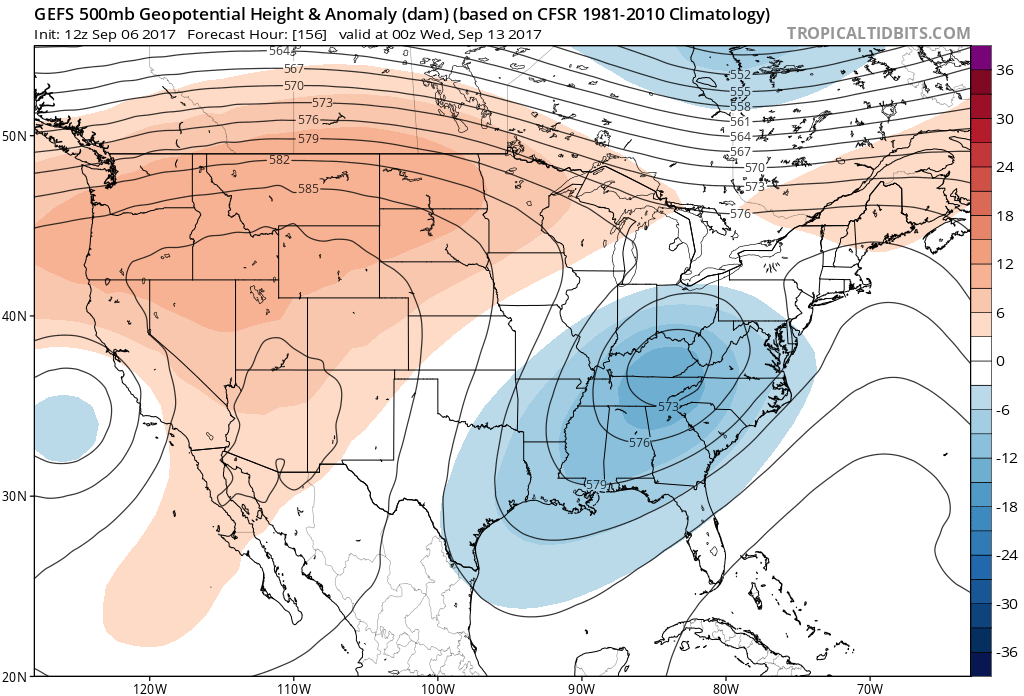
Watch it move northward early next week.
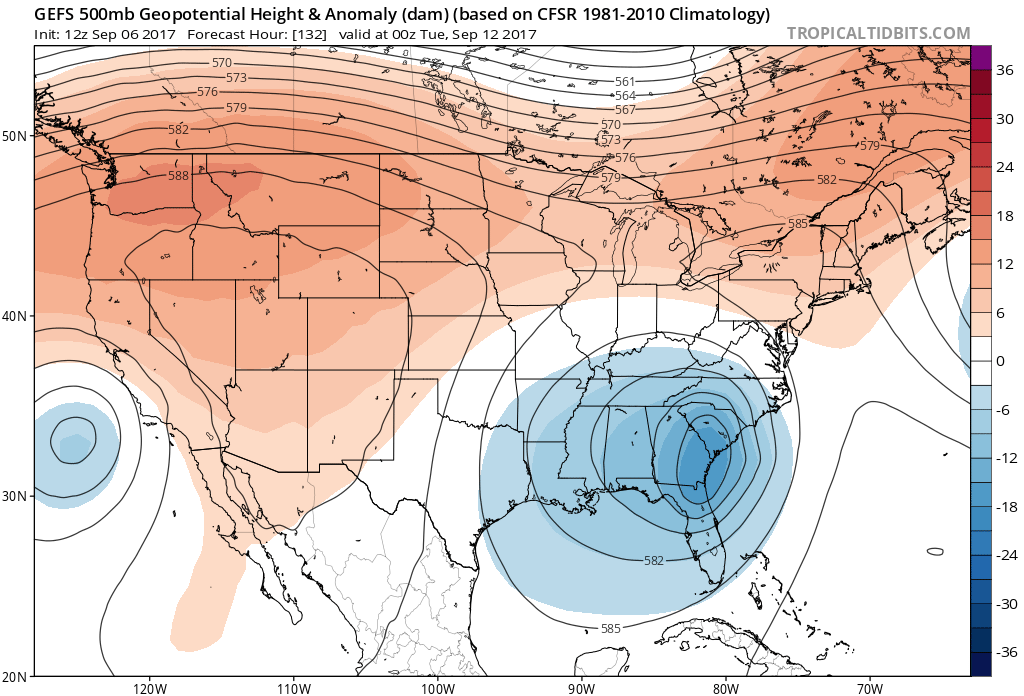
Then, the GFS brings it into the TN Valley and OH Valley. Not sure I buy this solution. I will monitor the trends. I just wanted to point that out to you. Some models bring wind and rain into our region.
This map is for next Tuesday night/Wednesday morning.
Let’s take a look at some additional long range data.
Click to enlarge
Main ideas
- Below normal temperatures to continue
- Watching Irma next week
- Some indications of a strong cold front around September 16th and 17th
- End of month cold?
- Data is trending cooler for October, but uncertainties remain
- Weak La Nina this winter? Seems more and more likely. That would mean a mixed forecast in our region. We might ride the warmer than normal vs colder than normal. Low confidence, of course. Way too far out for certainties.
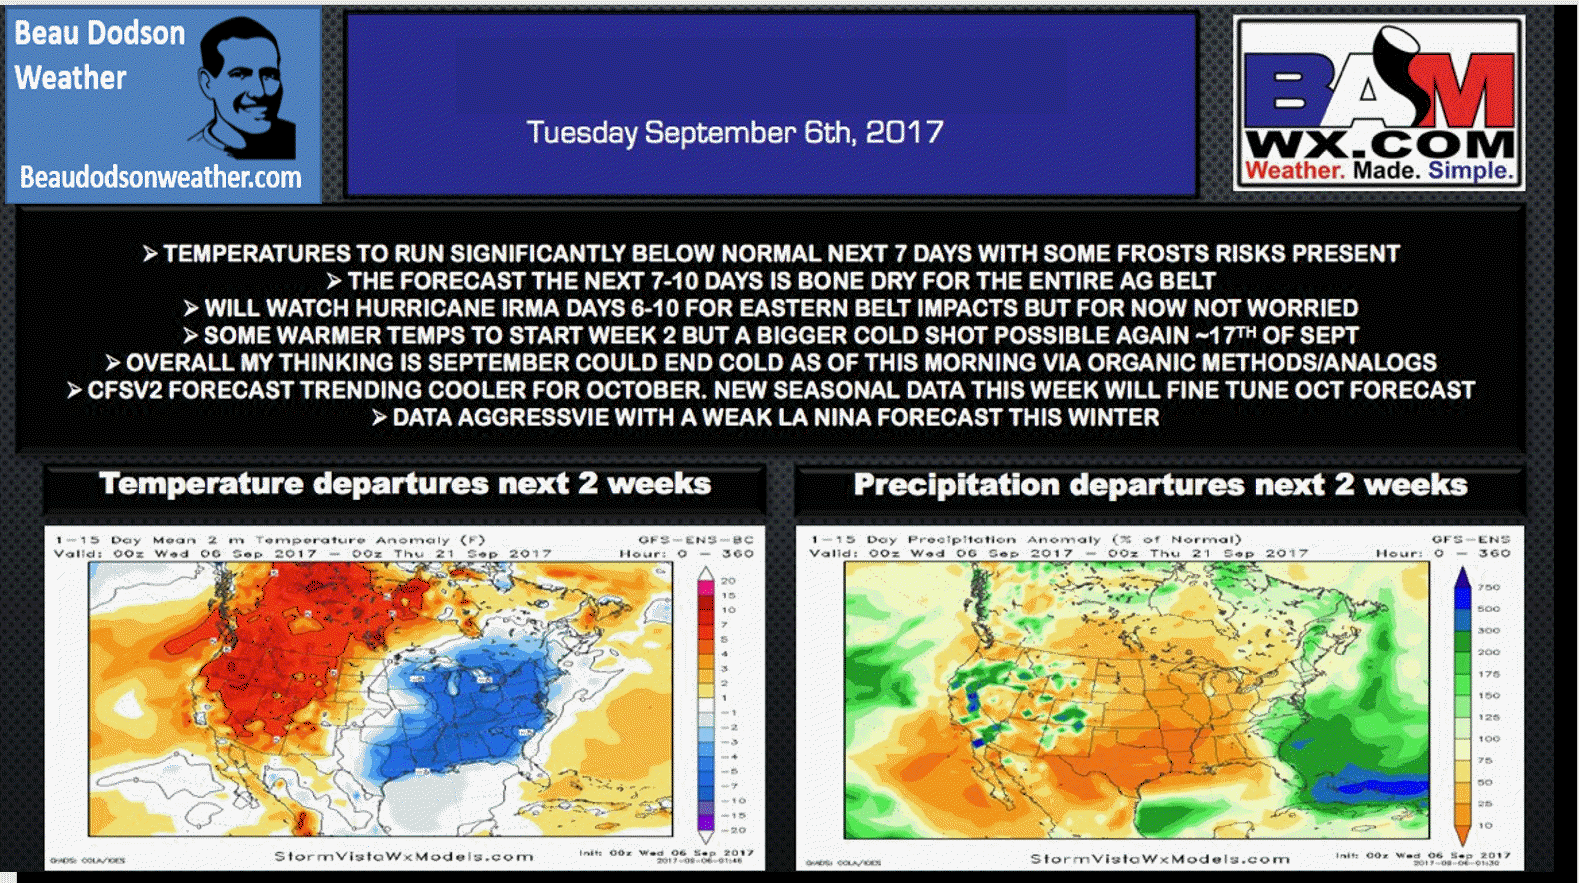
Graphics
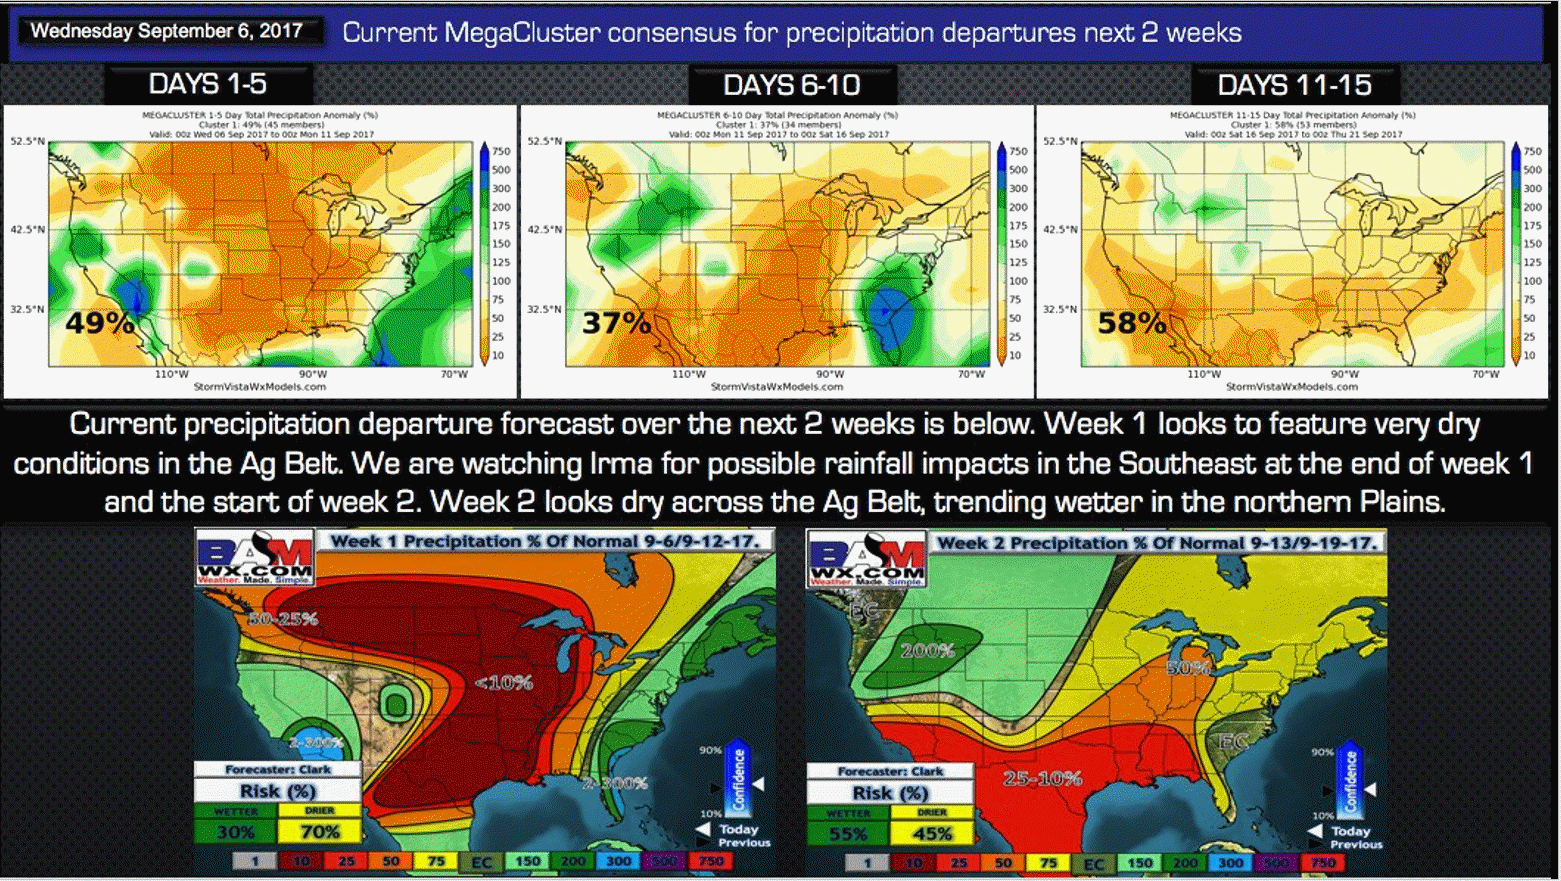
The bottom two graphics are the temperature and precipitation departures for the next two weeks. These graphics are using the organic forecast methods. You can see that below normal temperatures and below normal precipitation is favored.
Here is the current megacluster data. Megacluster means all of the models blended together.
Days one through five favor below normal temperatures. Same for days six through ten. Days eleven through fifteen are equal chances (for now).
Click to enlarge. The top three graphics are the model forecasts. The bottom two maps are the organic forecast. The bottom two graphics would be our forecast.
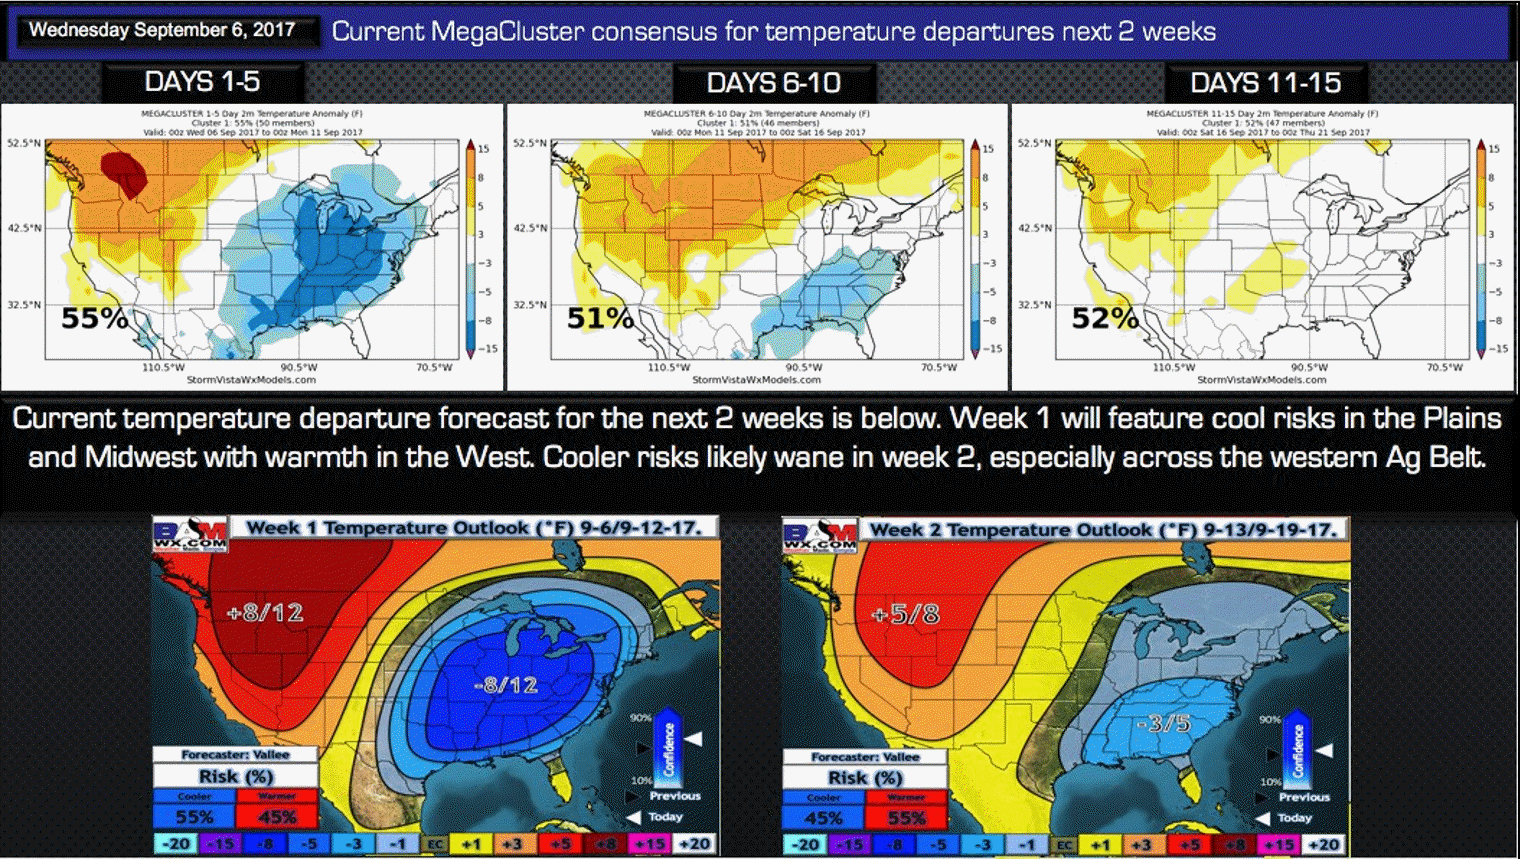
Precipitation should average below normal. That assumes that Irma avoids our region.
The top three charts are the megecluster model forecasts. They all favor below normal precipitation.
Our forecast (bottom two graphics) favor below normal precipitation.
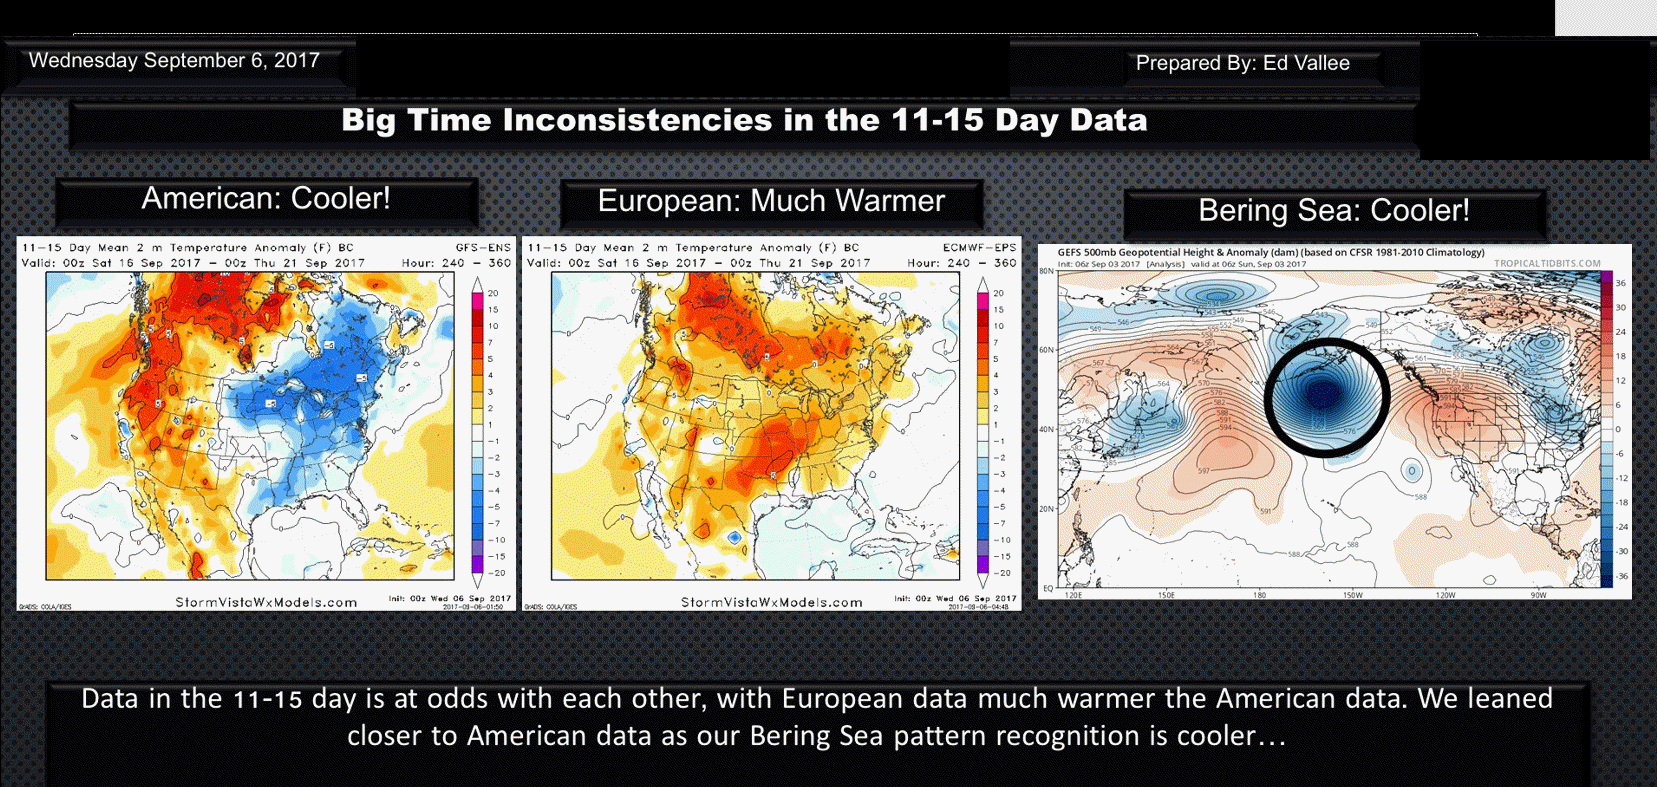
Longer range
GFS and EC data do not agree in the 11 to 15 day time frame. GFS is much cooler and EC is much warmer. That adds uncertainties for mid-month.
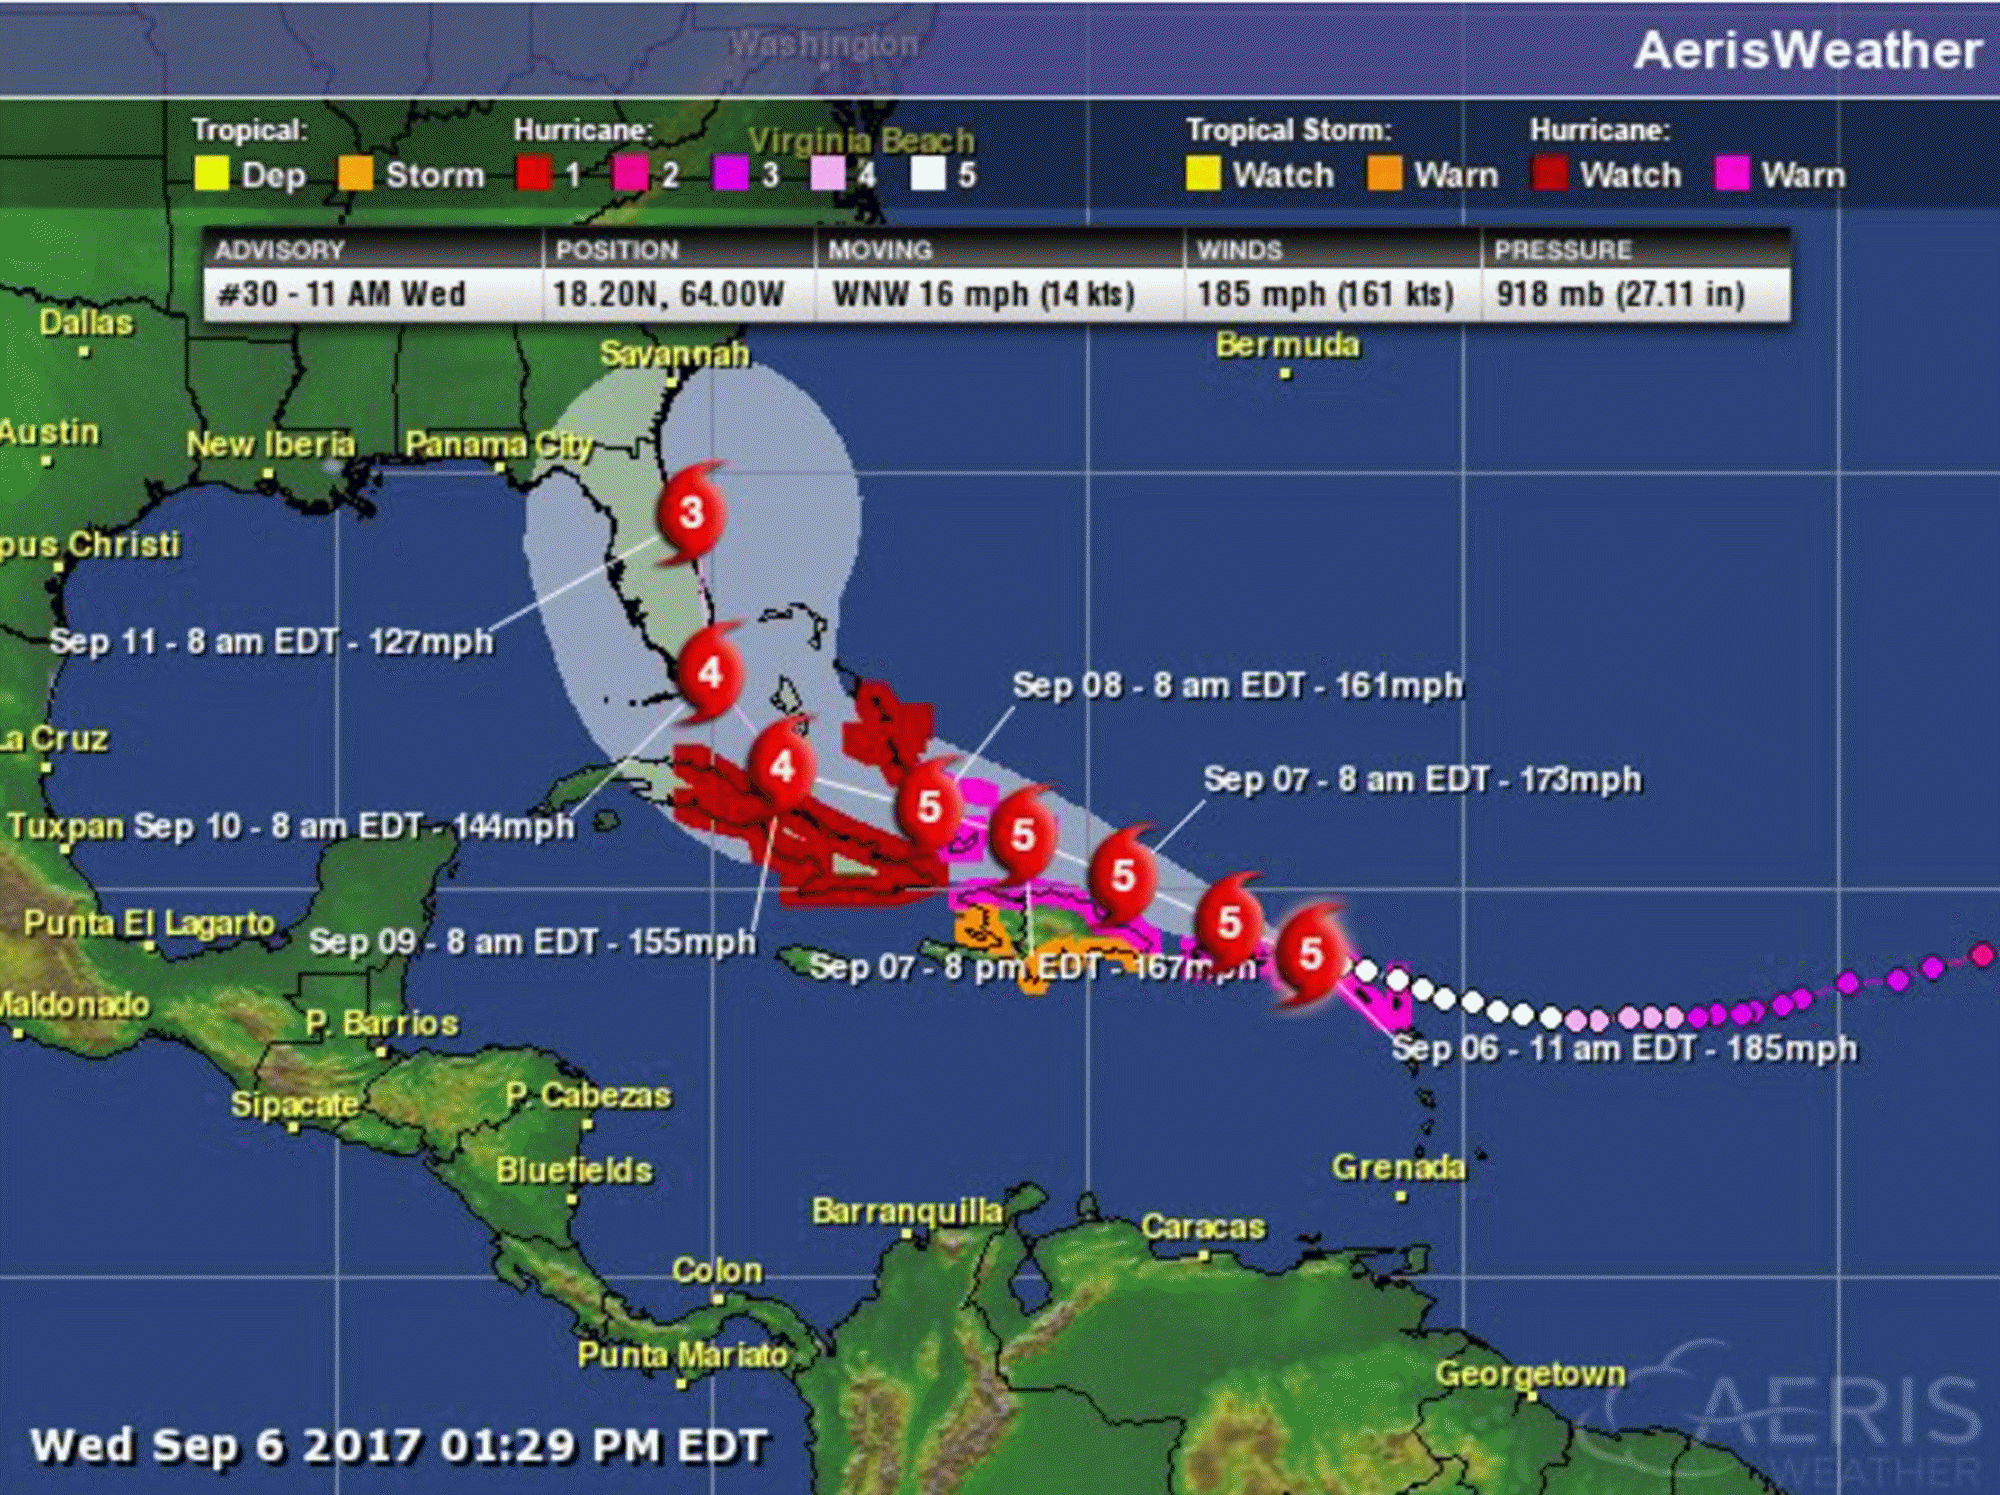
Here is the official NHC forecast track for Irma. It has shifted further and further east. Remember, at one time it was going into the Gulf of Mexico. Trends are key.
2
3
Here is the latest long range bonus video for subscribers from Meteorologist Ed Vallee’s afternoon update